This isn't a trend, but I seem to be rather busy on Thursdays. So much so that yesterday's demo didn't happen. Perhaps I'll describe what I was up to at some later point.
Today, however, I took advantage of the light output from an iPad. Many computing devices that have an LCD type screen emit polarized light. It's why I rarely wear sunglasses when I'm out taking pictures - the polarized glasses cut out too much - sometimes all - of the light from the review screen on the back. Wearing polarized sunglasses and looking at a computer can also be tricky.
But stick the iPad behind a transparent, isotropic material and then slap a polarized filter in front of the camera and you have an instant stress-field viewer. I redid the shot of a small cap gun charge through gelatin, but this time the only light was coming from an iPad.
This turned out much better than I had hoped. First, I didn't have a lot of light to work with. Second, many computer screens will produce scan lines because the screen is "refreshing" at some frequency (it's why video of older phosphor screen monitors "flicker"). But the iPad sent out a nice steady light (I made a blank white slide in keynote and just had that as the display).
Now I think I need to get my hands on some of those old fashioned 4"x4" rock thin sections and try photographing them...
Showing posts with label thurs-demo. Show all posts
Showing posts with label thurs-demo. Show all posts
Friday, March 23, 2012


Friday, March 16, 2012
Thurs-Demo: The One There's Always Room For
So, how do you show students the effects of deformation on various materials? How do you show the accumulation of strain, or the propagation of sound waves through solid rock? You can do it in real time with some polarized filters and gelatin.
Here's a picture of our setup:

We had the bright lights up so we could get some high speed footage. That also meant the gelatin started to melt, so we were limited to about half an hour of shooting.

Here's one of the high-speed shots. I dropped a steel ball onto the gelatin. You can see the "goopy" behavior of the stuff along the top edge as well as the initial deformation followed by the surface waves radiating outward from the impact.
Now for some slicing up with a knife. I like the little "shocks" that radiate outward as I dragged the knife through the stuff.
Finally, here's another ball, dropped onto the cut gelatine. Some interesting additional wave behavior developed.
Those of you who consider yourselves "strain junkies" (yes, I'm making that a term) may be wanting some more detailed information about what's going on from a mechanical perspective. I think my colleague Todd, over at Talking Physics is planning on a more detailed discussion of the mechanics of Jello...
Here's a picture of our setup:
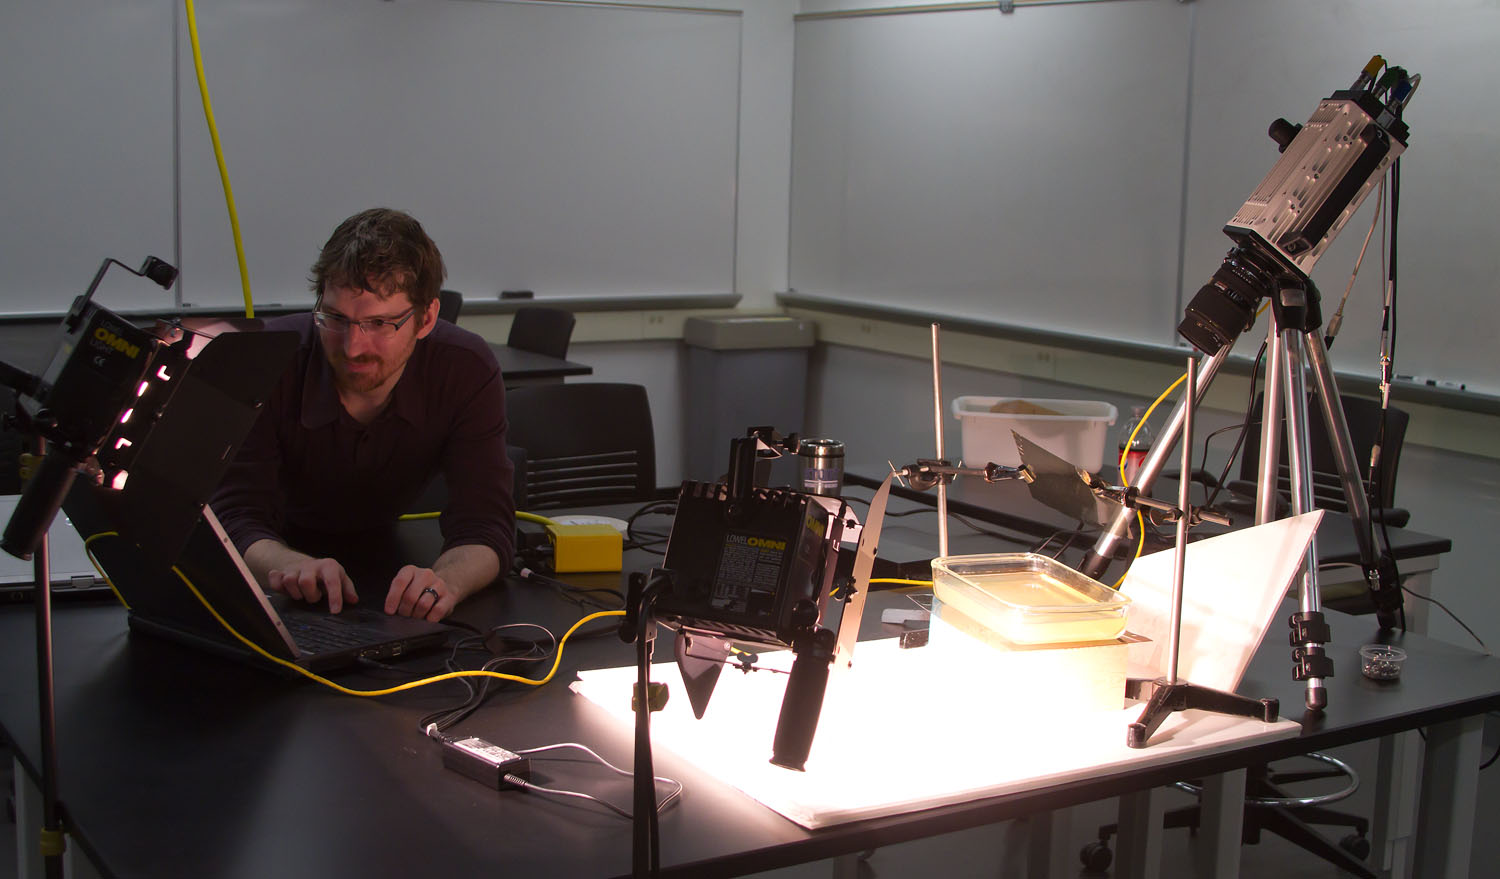
We had the bright lights up so we could get some high speed footage. That also meant the gelatin started to melt, so we were limited to about half an hour of shooting.

Here's one of the high-speed shots. I dropped a steel ball onto the gelatin. You can see the "goopy" behavior of the stuff along the top edge as well as the initial deformation followed by the surface waves radiating outward from the impact.
Now for some slicing up with a knife. I like the little "shocks" that radiate outward as I dragged the knife through the stuff.
Finally, here's another ball, dropped onto the cut gelatine. Some interesting additional wave behavior developed.
Those of you who consider yourselves "strain junkies" (yes, I'm making that a term) may be wanting some more detailed information about what's going on from a mechanical perspective. I think my colleague Todd, over at Talking Physics is planning on a more detailed discussion of the mechanics of Jello...
Friday, March 09, 2012
Thurs-Demo: Well here's your problem...

I was trying to make large borax crystals for a lab/demo involving crystallization. What I ended up doing was cracking a 1000mL beaker. Not because of temperature extremes. I think it cracked because the borax crystals were pushing on the sides of the beaker as they formed (out of saturated solution). Oops. Now I have a slight mess to clean up because there was probably another 500mL of water that ended up leaking out of the cracked beaker.
But, the experiment wasn't a total loss. While I don't have much to add in the way of a crystallization demo, I now have a way to demonstrate what salt does when it crystallizes in small cracks and spaces within rock, concrete, etc. As the crystals form, the individual atoms try to get onto the crystal lattice and sometimes they'll push things out of the way so the crystal lattice can form. If that thing being pushed out of the way is weak enough, the forming lattice might break stuff. In this case it was the beaker. In the case of concrete and asphalt, the salt spread on ice to melt the ice comes out of solution as the water dries up. Those salt crystals grow and start pushing on cracks and spaces in the concrete, causing pieces of the roadway to break apart. In rock, salts from weathering minerals can help bust the large rock into smaller ones.
This process, called "Salt Wedging" is under appreciated as a source of physical weathering. It's not the chemical reaction of the salt with the rock, but rather the physical stress the growing crystal applies to the surrounding rock. Or, in this case, beaker... now I have to go get a mop.
Thursday, February 16, 2012
Thurs-Demo:The One that Glitters
I've been thinking of a pop culture reference for today's post. I was mulling the thought of using a Tolkien-Aragorn reference, or perhaps a Twilight-Vampire comment. Instead, I'll just let you know that pearlescent paint/ink has some great potential for demonstrating fluid dynamics.

Mix a water-based pearlescent paint (this one is probably made with powdered aluminum) with water and stir. Watch lovely Von-Karmen vortices whirl about. See the transition from laminar to turbulent flow. All this can be yours for a few bucks worth of paint.
Or, if you're so inclined, mix a very thin suspension in water and then use the glittery parts to help track where the water goes.

Mix a water-based pearlescent paint (this one is probably made with powdered aluminum) with water and stir. Watch lovely Von-Karmen vortices whirl about. See the transition from laminar to turbulent flow. All this can be yours for a few bucks worth of paint.
Or, if you're so inclined, mix a very thin suspension in water and then use the glittery parts to help track where the water goes.
Thursday, February 02, 2012
Thurs-Demo: The One with Room for Cream
Getting one drop to hit another takes some timing. The higher viscosity of the cream makes it easier to get short spacing between the drops.
Thursday, January 19, 2012
Thurs-Demo: The one with a Slinky
Today's demo: P and S-wave propagation using a slinky. When talking about earthquakes, it's often hard for students to "see" the relative motion of energy through rocks. We often use a slinky or a large spring to demonstrate the behavior of waves moving through a solid material. Trouble is, the movement of the wave is so fast, it's sometimes hard to see. What better way to slow things down than with the high-speed camera?
I haven't done any motion tracking, but I don't think the pressure wave is traveling any faster than the transverse (shear) wave in the spring - I think the spring is too "springy" so there's no discernible difference in velocity between the two.
I haven't done any motion tracking, but I don't think the pressure wave is traveling any faster than the transverse (shear) wave in the spring - I think the spring is too "springy" so there's no discernible difference in velocity between the two.
Thursday, January 05, 2012
Thurs-Demo: The one with Warts
Although I mainly teach introductory geology, I have taught other upper-level geology courses. One of my favorite topics is bedding structures (ripples graded beds, mudcracks, etc). The differences in those bedding structures formed by moving water compared to those formed on land by moving air are particularly helpful when interpreting the environment of formation of a particular unit of sedimentary rock. Combine a stack of these units into a stratigraphic column and you have a record of environmental change over time. Compare one stratigraphic unit to an adjacent unit of the same age and you have environmental change over spatial scales. Combine the vertical analysis of time with the spatial analysis and you have a four-dimensional study of an area. Time and space. All from a set of lovely sediments all piled up together (more or less depending on your field area).

Here's a lovely example of some bedding structures from the Chinle Formation (Triassic) of Utah. There are some interesting drag marks and some other traces that my ichnologists might be able to tell more about. But the lumpy ridges are what struck me. They aren't normal ripples where you might see some distinct cross laminations to give you a sense of fluid flow direction. They're also kind of "smooshed" at their crest, suggestive of some kind of soft-sediment deformation after they formed.
My current thought is that these are adhesion structures. These are ripples, ridges and bumps (wonderfully called "warts") that form when wind blows loose sand across a wet surface. If you live near the beach, or - for those of us in colder climes - walk across a parking lot on a windy winter day, you may see little bumps as the snow bounces across and then sticks to the wet pavement.

Here are some "nivean adhesion warts" that formed as snow blew loose snow across a wet sidewalk last winter. The orange BB is 6mm in diameter.
You can make your own adhesion warts - all you need is a wet paper towel and some fine sand. Here's a quick video:
Oh, and since my department has a fancy new camera, it would be cruel of me not to show you some of these sand grains bouncing across a wet surface in slow motion, here you go (I suggest going full-screen for this one)
Adhesion warts are probably my favorite bedform. In part it's got a great name. But also, they are clear indicators of terrestrial sedimentation. You really can't form these things underwater because there's no surface tension to allow the sediment grains to "stick" to each other underneath the water.

Here's a lovely example of some bedding structures from the Chinle Formation (Triassic) of Utah. There are some interesting drag marks and some other traces that my ichnologists might be able to tell more about. But the lumpy ridges are what struck me. They aren't normal ripples where you might see some distinct cross laminations to give you a sense of fluid flow direction. They're also kind of "smooshed" at their crest, suggestive of some kind of soft-sediment deformation after they formed.
My current thought is that these are adhesion structures. These are ripples, ridges and bumps (wonderfully called "warts") that form when wind blows loose sand across a wet surface. If you live near the beach, or - for those of us in colder climes - walk across a parking lot on a windy winter day, you may see little bumps as the snow bounces across and then sticks to the wet pavement.

Here are some "nivean adhesion warts" that formed as snow blew loose snow across a wet sidewalk last winter. The orange BB is 6mm in diameter.
You can make your own adhesion warts - all you need is a wet paper towel and some fine sand. Here's a quick video:
Oh, and since my department has a fancy new camera, it would be cruel of me not to show you some of these sand grains bouncing across a wet surface in slow motion, here you go (I suggest going full-screen for this one)
Adhesion warts are probably my favorite bedform. In part it's got a great name. But also, they are clear indicators of terrestrial sedimentation. You really can't form these things underwater because there's no surface tension to allow the sediment grains to "stick" to each other underneath the water.
Friday, December 23, 2011
Bonus Thurs-Demo: The One Dropping a Slinky
Have you ever dropped a slinky? If you've never looked closely at a free falling slinky, well you've come to the right place. But dropping a stretched slinky doesn't do what you might think. Take a look at the high speed:
Rhett Allain went so far as to build a computer model of a falling slinky to illustrate why the bottom of the slinky doesn't move until the top catches up. (Down?)
Rhett Allain went so far as to build a computer model of a falling slinky to illustrate why the bottom of the slinky doesn't move until the top catches up. (Down?)
Thursday, December 22, 2011
Thurs-Demo: The one in Slow Motion
New technology is fascinating. I've spent the day setting up a new camera that just arrived. Here's a little demonstration:
Thursday, December 15, 2011
Thurs-Demo: The One that Rises
Whew! Another semester is almost finished. Just a couple of final exams and #gradingjail to go now. Here's a demo that isn't exactly quick - to really see the results you need to let the thing go for about 1000 hours...
The height above some free water surface (such as the water table) that surface tension can "pull" a column of water is proportional to the size of the pores between the soil grains. Like "capillary tubing" where the narrower the diameter of the tube, the higher water can move above the free water surface, the smaller the space between granular particles, the higher the capillary rise. This demo works well in medium and fine sands, although the highest capillary rise (perhaps up to a few meters) occurs in silts. There is minimal capillary rise between tiny clay particles due to their shape - they pack together closely enough to inhibit water movement.

The graph above shows the results from several iterations of the experiment. The colored dots represent the experiment that is ongoing (and shown in the video). What's really cool is that by using video tracking, I can refine my time measurements down to the first few seconds of the experiment. Expanded to 1000 hours, that gives me a data set that covers over seven orders of magnitude. I'm struck by how consistent this movement is between experimental runs and different grain sizes (the higher the mesh number, the smaller the particles).
The height above some free water surface (such as the water table) that surface tension can "pull" a column of water is proportional to the size of the pores between the soil grains. Like "capillary tubing" where the narrower the diameter of the tube, the higher water can move above the free water surface, the smaller the space between granular particles, the higher the capillary rise. This demo works well in medium and fine sands, although the highest capillary rise (perhaps up to a few meters) occurs in silts. There is minimal capillary rise between tiny clay particles due to their shape - they pack together closely enough to inhibit water movement.

The graph above shows the results from several iterations of the experiment. The colored dots represent the experiment that is ongoing (and shown in the video). What's really cool is that by using video tracking, I can refine my time measurements down to the first few seconds of the experiment. Expanded to 1000 hours, that gives me a data set that covers over seven orders of magnitude. I'm struck by how consistent this movement is between experimental runs and different grain sizes (the higher the mesh number, the smaller the particles).
Thursday, December 08, 2011
Thurs-Demo: The One with Frickin' Laser Beams
I've got a few demos cooking (or boiling up), but here's a quickie with the index of refraction. I used a ring stand and a few clams to hold some laser pointers above an aquarium.

Using Photoshop to measure the incident and refracted angles. Based on a reference I found online, the measured index of refraction compared to the expected values were off by less than 1%. Not bad for a quick and dirty setup. Check out how close I managed to get the lasers aligned, too.

On a side note several materials fluoresce in the blue laser light. So I put a few drops of fluorescent dye into the tank and waited for something interesting to happen.

Oh, and by the way - some of this refraction stuff is why you can get a "green flash" at sunset. You can find some more on the hyperphysics website at Georgia State and a detailed review of the phenomenon by Andrew Young.
When my wife and I were in Hawaii, I managed to see the green flash on three different evenings over the 10 days we were there - not a bad average.(darn, pics are on a different drive, so that will have to wait - sorry).
And now the flash:


Using Photoshop to measure the incident and refracted angles. Based on a reference I found online, the measured index of refraction compared to the expected values were off by less than 1%. Not bad for a quick and dirty setup. Check out how close I managed to get the lasers aligned, too.

On a side note several materials fluoresce in the blue laser light. So I put a few drops of fluorescent dye into the tank and waited for something interesting to happen.

Oh, and by the way - some of this refraction stuff is why you can get a "green flash" at sunset. You can find some more on the hyperphysics website at Georgia State and a detailed review of the phenomenon by Andrew Young.
When my wife and I were in Hawaii, I managed to see the green flash on three different evenings over the 10 days we were there - not a bad average.
And now the flash:
Sunday, November 13, 2011
Thurs-Demo: The One with (Specific) Gravity
This week's demo has been a little late in coming - but I've got a few moments to get this up. Video is still processing though...
The plastic media that comes with the Emriver stream table is made of ground-up plastic. The stream model's physical behavior is largely determined by the relative difference between the density of flowing water and the sediment (there's also the viscosity of water, but that's another set of posts).

The above graph shows my student's results from soil mechanics lab last week. Students' results (red points) are a bit more varied than mine (blue). Aside from one errant point, student results lie along, or to the left of my own results - this suggests to me that it's a measurement error, rather than very different material. The leftward distribution points to less water than expected, rather than more. This could be the result of letting too much water dribble down the side and not into the measuring container, or waiting for all the water to stop dripping out of the spout. Or that the coarser fraction doesn't displace water as easily as a more graded mixture. Still, for 10-15 minutes worth of lab work, not a bad set of data.

This graph shows the results from a more extended set of measurements. The lab had students using a small (~100ml) overflow beaker - small errors like missed drops end up having a very large effect. So I tried using a much larger overflow beaker. My results were very consistent (basically a SG of about 1.50 ±0.01). But these values are a bit lighter than what Steve Gough (head of the LRRD) had for their color-coded material at 1.7. It's possible that my method allows for too much material to cling to the top of the beaker. Or the air bubbles trapped next to the surface of the plastic result in lighter-than-actual measurements.
So why graph the data this way? I can measure the plastic media's mass very accurately. And the amount of water displaced is proportional to the specific gravity of the material. So by making a bunch of measurements of two values, I can define a third as a linear function of the other two. It also saves some time on the calculation side of things.
The plastic media that comes with the Emriver stream table is made of ground-up plastic. The stream model's physical behavior is largely determined by the relative difference between the density of flowing water and the sediment (there's also the viscosity of water, but that's another set of posts).

The above graph shows my student's results from soil mechanics lab last week. Students' results (red points) are a bit more varied than mine (blue). Aside from one errant point, student results lie along, or to the left of my own results - this suggests to me that it's a measurement error, rather than very different material. The leftward distribution points to less water than expected, rather than more. This could be the result of letting too much water dribble down the side and not into the measuring container, or waiting for all the water to stop dripping out of the spout. Or that the coarser fraction doesn't displace water as easily as a more graded mixture. Still, for 10-15 minutes worth of lab work, not a bad set of data.

This graph shows the results from a more extended set of measurements. The lab had students using a small (~100ml) overflow beaker - small errors like missed drops end up having a very large effect. So I tried using a much larger overflow beaker. My results were very consistent (basically a SG of about 1.50 ±0.01). But these values are a bit lighter than what Steve Gough (head of the LRRD) had for their color-coded material at 1.7. It's possible that my method allows for too much material to cling to the top of the beaker. Or the air bubbles trapped next to the surface of the plastic result in lighter-than-actual measurements.
So why graph the data this way? I can measure the plastic media's mass very accurately. And the amount of water displaced is proportional to the specific gravity of the material. So by making a bunch of measurements of two values, I can define a third as a linear function of the other two. It also saves some time on the calculation side of things.
Thursday, November 03, 2011
Thurs-Demo: The one with Terraces
Part of my research deals with the history of rivers. Well, a few rivers in particular, but they are an example of how the landforms associated with rivers and streams can tell us about past changes to the river system. Terraces are one of my favorite. Terraces reflect periods of transition for the river system. Periods when something happened - whether it be tectonics, climate, or changes in the base level (lowest point) terraces mark a change from a stream that is relatively "stable" to a stream that is able to erode down into its floodplain.
Callan, over at Mountain Beltway, had a post about terraces last year. The picture below shows some of the work I'm doing along the Red Cedar River - a tributary of the Chippewa River - which itself is a tributary of the Mississippi River.

Depending on how picky I feel like being, I count over six terrace levels - possibly as many as ten. One of the questions I'd really like to answer is "how did these terraces form?" Did they form as a result of changes in sediment supply? Cutting off sediment supply (or increasing water discharge) allows the stream to pick up sediment along the floodplain and erode downwards. Or base level drop? A drop in the main stream would lower the mouth of the tributary. This would increase the slope of the stream locally. Increased stream flow would increase erosion. I've sketched out the two most likely scenarios for the Red Cedar below (I'm ruling out tectonics for now, but isostatic readjustment as a result of glacial retreat may play a role).

It's important to note that these terraces may not be synchronous - depending on the rate of erosion, one part of the terrace may form much later than another. Also, the direction that the terrace develops is different. With sediment supply, the erosion starts upstream and progresses downstream. By contrast, a drop in base level occurs at the mouth first and erosion progresses upstream.
This is rather an abstract concept. It's hard to intuitively understand these processes. That's where the Emriver model comes in. By manipulating the system, it becomes easier to see what's going on. But how well does the Emriver replicate these terrace forming processes? Pretty good, actually. Here's a video where I managed to alter sediment supply (by limiting the sediment mobilized upstream) and dropping the standpipe to simulate a fall in base level. Pay close attention to the direction that the incision propagates.
Callan, over at Mountain Beltway, had a post about terraces last year. The picture below shows some of the work I'm doing along the Red Cedar River - a tributary of the Chippewa River - which itself is a tributary of the Mississippi River.

Depending on how picky I feel like being, I count over six terrace levels - possibly as many as ten. One of the questions I'd really like to answer is "how did these terraces form?" Did they form as a result of changes in sediment supply? Cutting off sediment supply (or increasing water discharge) allows the stream to pick up sediment along the floodplain and erode downwards. Or base level drop? A drop in the main stream would lower the mouth of the tributary. This would increase the slope of the stream locally. Increased stream flow would increase erosion. I've sketched out the two most likely scenarios for the Red Cedar below (I'm ruling out tectonics for now, but isostatic readjustment as a result of glacial retreat may play a role).

It's important to note that these terraces may not be synchronous - depending on the rate of erosion, one part of the terrace may form much later than another. Also, the direction that the terrace develops is different. With sediment supply, the erosion starts upstream and progresses downstream. By contrast, a drop in base level occurs at the mouth first and erosion progresses upstream.
This is rather an abstract concept. It's hard to intuitively understand these processes. That's where the Emriver model comes in. By manipulating the system, it becomes easier to see what's going on. But how well does the Emriver replicate these terrace forming processes? Pretty good, actually. Here's a video where I managed to alter sediment supply (by limiting the sediment mobilized upstream) and dropping the standpipe to simulate a fall in base level. Pay close attention to the direction that the incision propagates.
Thursday, October 27, 2011
Thurs-Demo: The one with ping-pong balls
Have some ping pong balls? Have some liquid nitrogen (LN2)? You've got yourself a party! Poke two holes in a ping pong ball - angle the holes so they kind of slant sideways. They should point the same direction relative to some axis (think of a hero engine here). Now, dunk the punctured ball in the LN2. Then remove the ball (with tongs, folks - this is super-cold stuff) and as it warms up, it should start spinning.
I didn't think of this demo - there are some pretty cool videos that demonstrate this elsewhere on the internet. But I'm the only person I know of who put the ping pong under blacklights (long wave UV) and suspended it in a stream of air. Think of it as my "value-added" contribution to edutainment...
I didn't think of this demo - there are some pretty cool videos that demonstrate this elsewhere on the internet. But I'm the only person I know of who put the ping pong under blacklights (long wave UV) and suspended it in a stream of air. Think of it as my "value-added" contribution to edutainment...
Thursday, October 20, 2011
Thurs-Demo:The first one with the stream table
There's a new addition to the Dirt Lab's inventory. We're the proud owners of a shiny Em2 stream table, manufactured by the folks at Little River Research & Design. Overall, I'm more than thrilled with the design and performance. I've spent the past week putting it through its paces and testing out some ideas for labs/demos for teaching and some research possibilities. I'll be adding more to this over time - the other bloggers who also have stream tables are invited to share ideas and perhaps we can have some kind of "users group" dedicated to extracting the most from these things. Maybe that's something that Google+ may actually be good for? Or perhaps with their redesigned site, perhaps the LRRD folks can provide a type of forum for these discussions.

Without much description, here are a few time lapse movies I shot over the last week. Each "run" was probably 1-2 hrs. The less "jumpy" ones were shot at 15 sec/frame while the others were made at 30 sec/frame. I shared a few previews on G+ last night and Steve Gough (LRRD's Prime Kahuna) mentioned a top-bottom view works better. Fortunately, iMovie lets me rotate the movie. So here's the adjusted film.

Without much description, here are a few time lapse movies I shot over the last week. Each "run" was probably 1-2 hrs. The less "jumpy" ones were shot at 15 sec/frame while the others were made at 30 sec/frame. I shared a few previews on G+ last night and Steve Gough (LRRD's Prime Kahuna) mentioned a top-bottom view works better. Fortunately, iMovie lets me rotate the movie. So here's the adjusted film.
Thursday, October 13, 2011
Thurs-Demo: The one that never ends

I'm helping with a field trip today, so I'm posting this to (hopefully) automatically appear in about 12 hours...
The other week, I mentioned the interesting behavior of the flume/pump system I had set up. Changes in one direction did not follow the same pattern as changes in the other direction. I stated (and still think this may be the case) that this could be an example of hysteresis.
Friday, October 07, 2011
Thurs-demo: The one that tried to listen to rivers
Brian Romans had a really neat post about "listening" to rivers a few weeks ago.

I had set up a demo to show some possible ways that we could "listen" to streams and arrive at some method of estimating bedload transport in streams. My set up was very simple. I had a short length of rain gutter stretched between two bins (one for water to flow into), an aquarium type pump, and some tubing to recycle the flow to the top of the rain gutter.
To "listen" to the river, I attached a microphone and an accelerometer from Vernier, hooked up to their Logger Pro software interface. The microphone was just a simple audio mic and it's range of frequency response was probably too fast (20 Hz) for a really good analysis (something around 1 - 10 Hz would be better, I think). The accelerometer was a simple, one-direction low-g unit. It's one of those that's sensitive enough that it will register a constant 9.8 m/s2 acceleration due to gravity if oriented vertically. Here's a sketch of the setup:

I intended to run the setup once without any sediment in the channel to provide a "baseline" of what the system would look like without a load. Then I was going to run the system with a bunch of coarse sand in the channel to observe the difference in the "noise" produced by bedload. Well, my experiment didn't get that far. The "noise" that I recorded for just the flowing water produced a very regular sine wave:

So, being the curious sort that I am, I began to wonder what could cause this pattern in the acceleration (as measured by the small accelerometer mounted on the rain gutter). First, you can tell the accelerometer wasn't mounted perfectly vertical, since the initial (and post-water movement) measurements are only around 8.6 (it should read 9.8). But then there are times it goes up (acceleration increases) and times it goes down (acceleration decreases). The total length of the test was 60 seconds - if you carry out the sine wave a little further, you can fit about 6 "wavelengths" in that time frame. That means there was something changing with a frequency of about 10 hertz. Was it something in the sinuosity of the flow? Was the stream meandering across the channel enough to make the channel wobble and register on the accelerometer?

The graph above is the result of four tests. In order to find out what is going on, the easiest thing to do is manipulate a variable or two, and see how the system responds. The variables I could easily change were: pump output (High/Low) and incline of channel (gentle/steep). That gives me four different tests. Low+Gentle (dark green), Low+Steep (light green), High+Gentle (dark blue), High+Steep (light blue). So, what explanations can you think of? Is there a consistent pattern in the data? Is there a fundamental flaw in my setup? I'm not sure - but it sure is interesting.
(PS - this is often how science works. Something looks interesting and we start trying to find an explanation. A mechanism or process that explains the observations. Sometimes the initial ideas don't pan out. Sometimes the work takes off in an unintended direction. But that's part of the fun!)

I had set up a demo to show some possible ways that we could "listen" to streams and arrive at some method of estimating bedload transport in streams. My set up was very simple. I had a short length of rain gutter stretched between two bins (one for water to flow into), an aquarium type pump, and some tubing to recycle the flow to the top of the rain gutter.
To "listen" to the river, I attached a microphone and an accelerometer from Vernier, hooked up to their Logger Pro software interface. The microphone was just a simple audio mic and it's range of frequency response was probably too fast (20 Hz) for a really good analysis (something around 1 - 10 Hz would be better, I think). The accelerometer was a simple, one-direction low-g unit. It's one of those that's sensitive enough that it will register a constant 9.8 m/s2 acceleration due to gravity if oriented vertically. Here's a sketch of the setup:

I intended to run the setup once without any sediment in the channel to provide a "baseline" of what the system would look like without a load. Then I was going to run the system with a bunch of coarse sand in the channel to observe the difference in the "noise" produced by bedload. Well, my experiment didn't get that far. The "noise" that I recorded for just the flowing water produced a very regular sine wave:
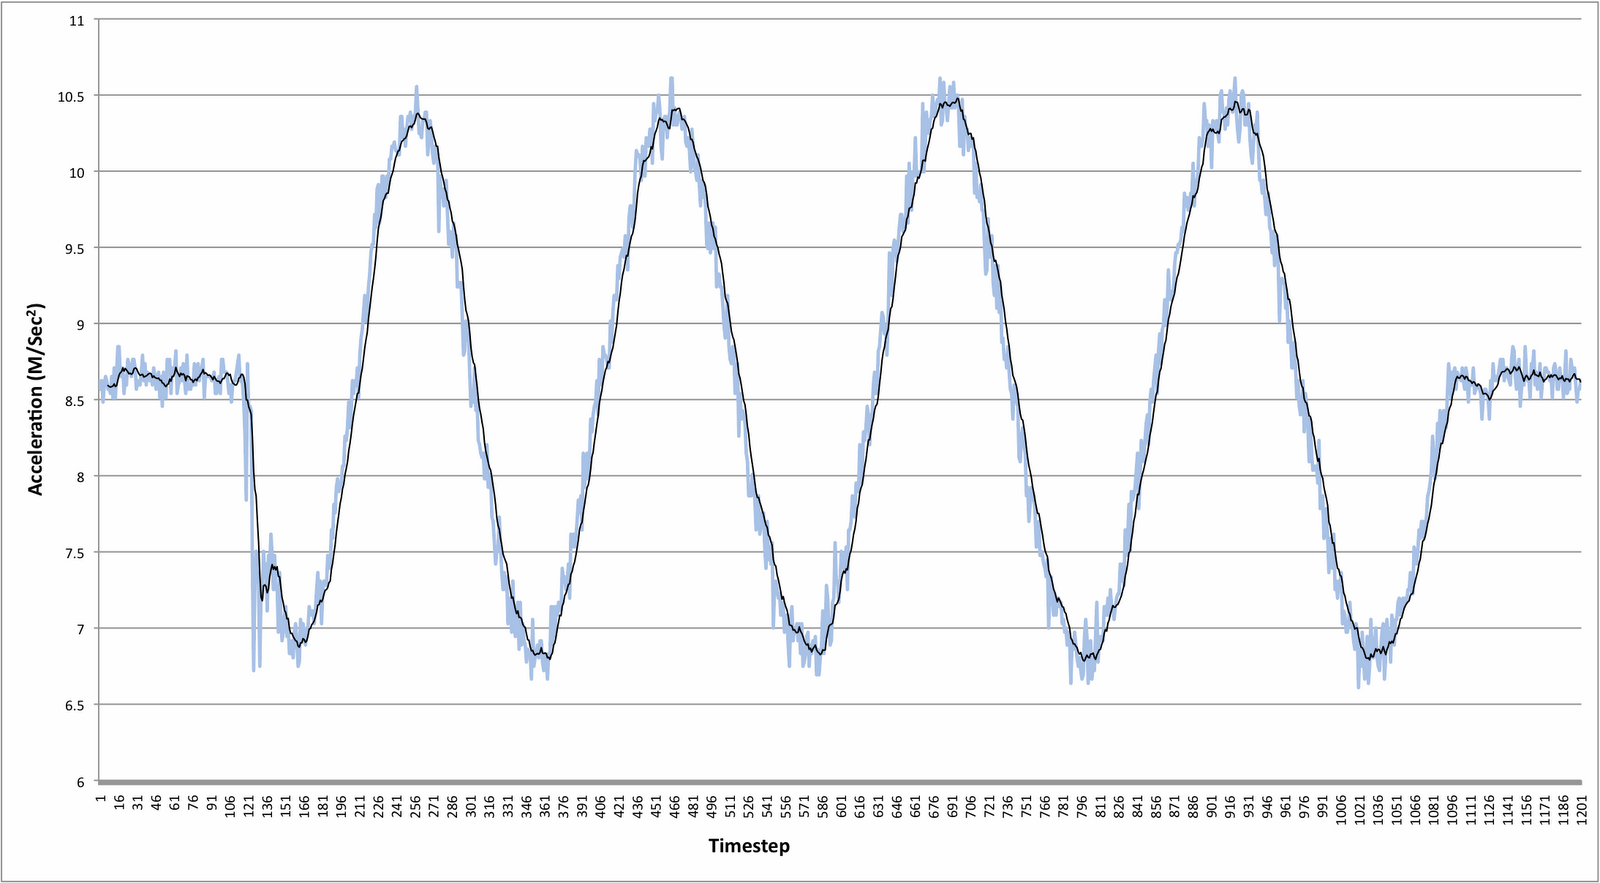
So, being the curious sort that I am, I began to wonder what could cause this pattern in the acceleration (as measured by the small accelerometer mounted on the rain gutter). First, you can tell the accelerometer wasn't mounted perfectly vertical, since the initial (and post-water movement) measurements are only around 8.6 (it should read 9.8). But then there are times it goes up (acceleration increases) and times it goes down (acceleration decreases). The total length of the test was 60 seconds - if you carry out the sine wave a little further, you can fit about 6 "wavelengths" in that time frame. That means there was something changing with a frequency of about 10 hertz. Was it something in the sinuosity of the flow? Was the stream meandering across the channel enough to make the channel wobble and register on the accelerometer?

The graph above is the result of four tests. In order to find out what is going on, the easiest thing to do is manipulate a variable or two, and see how the system responds. The variables I could easily change were: pump output (High/Low) and incline of channel (gentle/steep). That gives me four different tests. Low+Gentle (dark green), Low+Steep (light green), High+Gentle (dark blue), High+Steep (light blue). So, what explanations can you think of? Is there a consistent pattern in the data? Is there a fundamental flaw in my setup? I'm not sure - but it sure is interesting.
(PS - this is often how science works. Something looks interesting and we start trying to find an explanation. A mechanism or process that explains the observations. Sometimes the initial ideas don't pan out. Sometimes the work takes off in an unintended direction. But that's part of the fun!)
Wednesday, September 28, 2011
Thurs-Demo: The one that goes boom
It's Thursday. That means another demo. This week, I've been stricken with one of the various plagues that burns through college campuses at the start of the semester. All these viruses with thousands of brand new vectors. It's like some kind of frickin' holiday for them, or something. But since I was producing almost as much mucous as a netted hagfish, I didn't create a new demo this week. But, I have put together a little more information behind a demo I did last fall.
This demo came from an article and web page done by one of my former professors. Their write-up is well detailed and documented, so I'm not going to add much to what's in the journal article. If you really want to do this demo yourself, read what I have to say about my experience and then go read what Harpp et alia have to say. Pay special attention to the safety info. If you've never handled liquid nitrogen (LN2), you really want to pay attention. The stuff can be fun to experiment with, but only if handled safely.
I have embedded the video mashups from our demo runs below. Some things to look for include:
Okay, enough thinking. On to the explosions!
This demo came from an article and web page done by one of my former professors. Their write-up is well detailed and documented, so I'm not going to add much to what's in the journal article. If you really want to do this demo yourself, read what I have to say about my experience and then go read what Harpp et alia have to say. Pay special attention to the safety info. If you've never handled liquid nitrogen (LN2), you really want to pay attention. The stuff can be fun to experiment with, but only if handled safely.
I have embedded the video mashups from our demo runs below. Some things to look for include:
- Our first attempt exploded almost immediately. To make the bottle sink to the bottom, we poured it about 2/3 full of sand. This reduced the available gas volume and forced the bottle to burst too quickly.
- One attempt just sank to the bottom and then bubbled out. This was because I placed a "tall" cap on a "short-stem" bottle. Pay attention to this - some bottles have a shorter threaded neck and the taller caps won't seal properly.

- If you experiment with larger or smaller bottles, be sure that there is enough weight attached to the bottle. One of the runs shows the top of a bottle poking out of the water. This isn't very safe, because if you can see the bottle, there's nothing between you and a bursting pop bottle. The explosion was very loud. Fortunately, the bottle failed in a way that propelled it up into the air about 50 feet. Quite impressive, but loud and a little more hazardous than you want for an audience.
- The article suggests placing "ejecta" into the barrel. We tried practice golf balls. Ultimately, the surface we used was too uneven to allow for post-eruption particle tracking, but this has some interesting potential for enriching the demo with additional learning outcomes (plus, it gives students something to do while you're refilling the garbage can). I want to grab some whiffle balls of baseball and softball size and add them to the barrel. But you'll really need enough to completely cover the surface of the water, otherwise there won't really be much to see. As an added bonus, you can use the balls for particle tracking and estimate speed and size of the eruption column.
- I concur with Harpp et al. in their recommendations for a heavy-duty style, plastic garbage can. There's too much flexing and pressure to use metal or thin plastic, unless a burst and laterally-directed blast is what you want. I've used one of these garbage cans for about 10 explosions and it seems fine. The downward pressure does push the can into the ground, so avoid having sharp rocks or something like that underneath the container. They might puncture the can.
- Finally, go beyond the "big bang" and think about the physics behind this demo. Grab your ideal gas law and video tracking software. These demos used "about" 50 mL of LN2 for each explosion (the boiling LN2 makes it hard to get a real good estimate). And the can is the 32 gal size (filled with about 30-32 gal. of water each time). We can estimate height of the water column (and its approximate center of mass) and the time it took to get there.
- Some questions to consider:
- How much energy was released in the explosion
- Why does the garbage bin jump upward? Is it rebounding of the explosive force, or friction from the water moving upward, dragging the bin up with it?
- How could we rig the demo to create the largest possible eruption? (In our first series of tests, there didn't seem to be any obvious difference in column height between a 20 oz (0.6 L) bottle and a 2 L bottle.

Okay, enough thinking. On to the explosions!
Thursday, September 22, 2011
Thurs-Demo: The one that sooths
Okay, today's demo is just an illustration of what you can do with a handful of plasma globes and a couple of mirrors. Nothing fancy, just something to set the mood before we blow stuff up...

Plasma from Matt Kuchta on Vimeo.
Thursday, September 15, 2011
Thurs-Demo: The one with cleavage
Our department is getting a high-speed video camera. This alone is way-cool. However, while testing out some of the capabilities, it occurred to me that I might be able to use it to demonstrate how some minerals fracture along specific planes of weakness within the crystal. So, to try it out, I took a small calcite crystal and squished it with a pair of pliers.
It's not perfect - the frame rate (about 3,000 fps) isn't quite fast enough to capture subtle changes just prior to breaking, but it does show off plenty of tiny rhombohedral cleavage fragments spinning off as it breaks. This is one of those demos that is cheap to set up, but filming it requires the use of a rather expensive piece of equipment. But, oh is it pretty...
Mineral Cleavage Test from Matt Kuchta on Vimeo.
It's not perfect - the frame rate (about 3,000 fps) isn't quite fast enough to capture subtle changes just prior to breaking, but it does show off plenty of tiny rhombohedral cleavage fragments spinning off as it breaks. This is one of those demos that is cheap to set up, but filming it requires the use of a rather expensive piece of equipment. But, oh is it pretty...
Subscribe to:
Posts (Atom)