Wednesday, February 27, 2013

RSS and Google Reader test - can you see it?

A few months ago Ron Schott mentioned that my posts weren't appearing in his RSS feed. The other day Callan said that my images hadn't appeared in his Google Reader. It seems that if you go to the blog, you can see the images, but whether they appear on various aggregators/readers seems to vary. Also, the image I have as a background doesn't show up on my computer's browser, but it does show up on my iPad (mobile version).

So I'm going to post a few pictures - if you are willing, I'd appreciate a heads-up as to whether or not these things appear for you.

Picture 1 (from PhotoBooth, directly via computer)


Picture 2 (picture from camera, uploaded via computer)


Picture 3 (picture linked from Flickr)
SkaraBraePano3


Also - do you see a background picture?


Tuesday, February 26, 2013

Sketching the Crust some more

Okay, I'm relatively pleased with the appearance of the continental/ocean crust. Working on continental collisions is another thing. There are many temptations/shortcuts that are generally wrong - some more wrong than others.

Here's a draft of what I'm working on now:

Challenges abound since the crust is flying around in just about every direction. And one of the most prominent examples of a modern continental collision - the Himalayas - differ from just about everyone's diagrams because the highest peaks are much further out from the suture between the two continents than implied by textbook figures. Is that because the Himalayas are unique? Or because the geologic shorthand in the diagrams isn't sufficiently accurate?

Monday, February 25, 2013

Snow Mechanics

The warm weather this weekend has produced a fascinating effect on the snow coming off the roof of the student center.

SnoCurlHDR
I had the camera set to create an "HDR" image, so that's why it looks a little funky. I kept it, since it shows the structures in the snow rather well. Some nice folds, some inclined folds, and some interesting curling.


SnoCurl Closeup
Some of the snow has curled around into a complete spiral.

The process represents a balance between gravity pulling the snow down and the friction of the snow on the roof (so that it doesn't all come sliding down at once, or not move at all), plus the interaction between gravity and the internal strength of the snow/ice. Too week and the snow will just fall off the edge of the roof. Too strong and the snow won't deflect enough to produce the curl.

I don't remember seeing a curl so extreme that it's rotated back on itself in a spiral. Very cool. I wish I had a time lapse video of its formation/movement.


Sunday, February 24, 2013

A sidelong glance at Earth's crust

I've been working on relatively accurate sketches of the earth's crust to use in my lectures. Many times, our temptation is to use speed and generalizations to do something like this:
But this is quite far from an accurate representation. For one thing, ocean crust is only about 7 km thick, while continental crust near passive margins is at least 20 km thick. Along convergent boundaries where the crust is being thickened, it could be 50 or 60 km thick. Then there's the fact that the average depth of the ocean is about 3.5-4 km deep and the tallest mountains on Earth max out at almost 9 km. As a general characteristic, for every kilometer in elevation, the crust increases its total thickness by about 6 km.

Consider also that the average elevation of the Tibetan Plateau's is about 4.5 km, which means that the top of this 20 – 60 km thick continental crust projects around 4 to 12 km above the top of the ocean crust. Leaving a good ten, twenty, fifty or more km worth of continental crust to poke down into the upper mantle. To a proper vertical scale, the relationships would look more like this (although the lithosphere is just kind of thrown in there without much consideration for it's 100 km thickness...):


The horizontal scale in this sketch, however, is greatly compressed. The continental shelf, which may be upwards of 100km wide, is only about as wide as the ocean crust is thick (7 km), so the overall vertical exaggeration is probably about 14x "normal." This is still somewhat ungainly despite being reasonably accurate. But here's a slightly modified version:


The ratio of elevation to total thickness is about 1:4 and I've exaggerated the surface elevation changes more than the underside of the crust. Although at ~10x vertical exaggeration, the angle of subduction as drawn is probably too shallow (unless you're a fan of Laramide-style crustal thickening).

Next step is to try and see how this shorthand lends itself to drawing continental collisions...

Tuesday, February 19, 2013

Yet Another Epic Sunday Visit to Castle Gaiman

It's getting to be a habit. A wonderful, bizarre habit of trekking over to Neil's place over the weekend because there are fabulous people in from out of town. Fabulous people who do fabulous things. And they often visit people like Neil and Kelly McCullough, because an author is sort of the "quantum mechanic" of the art world.

And then there are people who are drawn to that world because its simple existence is fascinating. Kyle Cassidy is one of those people - his photographs have a documentary materialism coupled with a surreal "screw the fourth wall" kind of inventiveness that I really enjoy. He recently travelled to the boom camps of North Dakota with some researchers to study and document these ephemeral communities. It's a uniformitarian approach to the gold rush. We don't have a gold rush, but we've got this other resource extraction boom and the population growth trends are similar - how might the present "rush" be the key to those in the past?

This was my first chance to actually say hello and, hopefully, talk a little shop. We got a chance to chat, but what Kyle was really interested to see was my department's high speed camera in action. Keep in mind that the camera is called "high speed" because it takes in thousands of images each second, whereas a normal TV video camera captures 30 images each second (well, 29.97 actually, but I really never figured out where that 0.03rd of a frame goes). We refer to the resulting video, when played back at a normal 30 frames per second, as "slow motion". So a video recorded at 1,000 frames per second and played back at 30 frames per second takes 33 times longer than normal (1000/30).

What to do for high speed video in the middle of winter? Easy - throw snowballs. At their heads. So we lined up some volunteers and pelted them with some snow. And Todd (Talking Physics) and I recorded it at 1,000 frames per second. For Science!
SnowMotionScience from Matt Kuchta on Vimeo.

Wednesday, February 13, 2013

M&M teaching

Charles Carrigan over at Earth-Like planet has posted a lab activity using M&Ms to teach students about geochronology. I love the method of using the M&Ms as a random number generator (m-up or m-down). The data collection methods could easily be used in a different class to talk about exponential decay and the physics/math behind the phenomenon.


Sunday, February 10, 2013

Magma Fractionation Activity

I've been working on a "hands-on" student activity where they can see how molten rock can form igneous rocks of varying composition (fractionation/differentiation). Using M&M type candies in a plastic bag (representing the magma chamber), specific color pairs represent "minerals." Placing them on the plate represents crystallization. The rules of the game only allow certain color pairs to be formed with each step (crudely representing Bowen's Reaction Series).

M&M "magma chambers" ready for students to use.

I'm drafting revised instructions with illustrations to help explain the activity.


By tracking the type and number of M&Ms with each step, students can see how "Incompatible" elements increase in concentration.


My preliminary test with lab last week managed to produce a decent negative correlation between "Mafic"and "Felsic" constituents in the remaining magma.

While I put this together via my own ideas, I'm pretty sure the inspiration came from comments from other teachers. I checked the SERC website and found a more advanced version. But I haven't uncovered anything closer to what I've written up. If anyone out there in the blogosphere knows of something similar, feel free to leave a link in the comments. I want to refine this and clean it up, but I'm not that keen on "reinventing the wheel" if someone's already taken care of it.

Thursday, February 07, 2013

Art for the Geoscientist 1: Students, Please be Seated

Okay, this is never going to get done if I don't do it. I've mentioned it before, and a few of you have actually left positive feedback about the idea. So here we go:

Art for the Geoscientist, Lesson 1A: How to Draw a Rock


Attendance is not mandatory, nor will I keep track. But if you're interested in following along, you will need a few simple items:


  • A Pencil. Not a pen. Number 2, or HB pencils are most convenient, but any erasable graphite-based marking device will work.


  • An Eraser.


  • A few sheets of blank, unlined Paper. Preferably standard letter size (~A4), cut into half-sheets 5.5"x8.5"(140x213mm)


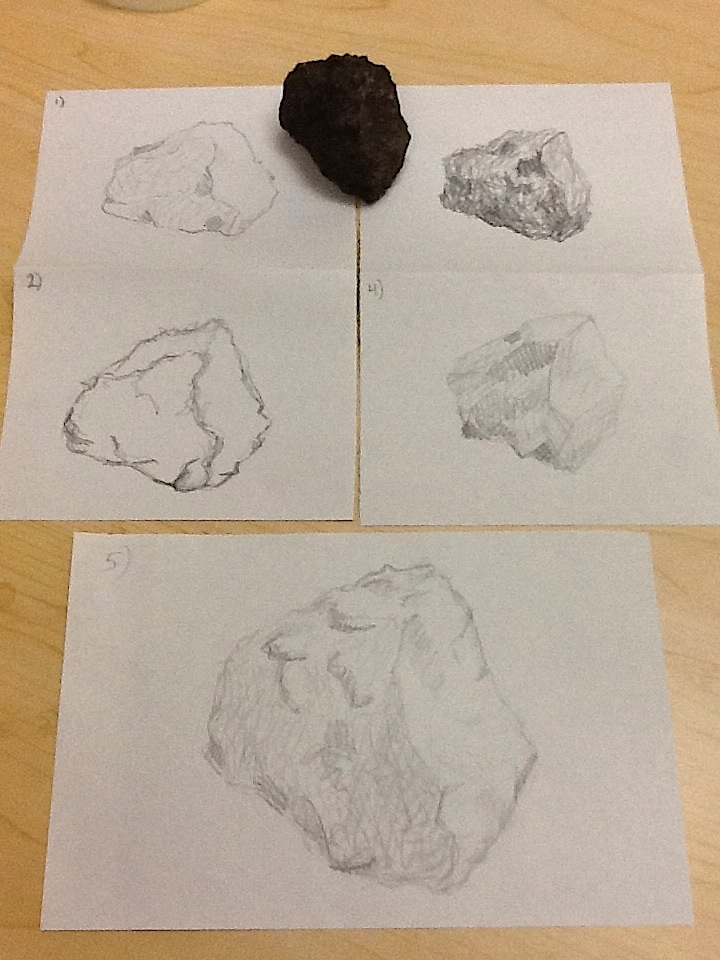
  • A Rock. I'm going to use a chunk of basalt from Iceland. I think a dark, uniformly colored rock would be easier to start with than one with lots of colors and patterns.


  • The first step is a simple one. We're going to draw a rock. Any reasonably sized rock will do. And we're not going to do anything fancy. The goal of the first part of the first lesson is just to get you loosened up and comfortable with making marks on the paper. Find a comfortable chair at a desk, or grab a conveniently sized clipboard. One more thing: Fold each half sheet of paper in half again so that it's only 4.5 inches tall by 5.5 inches wide.

    Sketch 1: Place the rock a few feet away from you and draw the rock as it looks in front of you. Do not allow yourself more than 2 minutes. Now flip the paper to the other side.

    Sketch 2: Draw the rock again, but this time you should do two things. First, DO NOT lift the pencil from the paper's surface. The graphite should always be in contact with the page, making marks. And rather than trying to draw all of the features of the rocks you see, focus on just drawing the outline of the rock. Again, don't take more than two minutes. Unfold the paper and fold it back on itself so the two previous sketches are on the inside of the fold facing each other.

    Sketch 3: Draw the rock one more time, but now only focus on the space that the rock occupies - DO NOT outline the rock at all - no thinking about edges! Fill in the "space" occupied by the rock itself - this is where a slightly dull or thicker pencil comes in handy. Try to keep your pencil on the paper, but if you need to lift it up, that's okay for now. After two minutes, put down your pencil. Flip the sheet over.

    Sketch 4: Now, focus on light and shadow. Break the rock into areas of lighter or darker parts and use the pencil to darken the shaded areas and leave the lighter areas with less (or no) marking. Just focus on blocking in areas that are lighter or darker than others. After two minutes, grab another half sheet of paper.

    Sketch 5: For the last part of the exercise, draw the rock as you see it in front of you again. This time, pay attention to the outline of the rock, the "space" the rock occupies, and the areas of light and dark. Don't focus on one aspect of outline, space, or shading more than the others. Give yourself up to 5 minutes for this sketch. When you are done, set your pencil down.

    There, that's it for now. I'll give you some time to try it out and if you're interested, you can post your results on the "refrigerator" in the comments below. I've got to go give a lecture about the rock cycle, so I'll be back later this afternoon with my own results. Have fun!

    Okay, here's my take. I have to be honest and say that I took a little longer than the suggested time, as my still-life skills are a little rusty.


    Saturday, February 02, 2013

    A Salute to tectonics

    This week, I made a somewhat flippant twitter comment about "back arc" basins being filled with pixie dust and unicorns. I appear to have touched a nerve, because a few of my fellow geologists on twitter (geotweeps) asked me if I was being critical of back arc basin development in general. Not really - but to give everyone more context than can be obtained in 140 characters, lemme 'splain...

    I've been reviewing some of the tectonic literature to improve the content of my introductory geology lectures and as part of a set of upcoming blog entries. I had been looking at the development of convergent plate margins like you might find along the western edge of South America, or along the northwest coast of the US. In an introductory class, we generally focus on a simple model for subducting ocean crust, like the picture below.

    Subducting Arc and Skarn

    You can see the dark blue ocean crust on the left being pushed downward and being overridden by the gray/light blue continental/transitional crust on the right. Fluids transported into the higher temperature mantle allow for partial melting of the surrounding rocks (forming blobs of yellow melt rising to form volcanoes in the picture). These melts mix with continental crust, fractionate, and interact with the surrounding rocks to produce really cool geology (and concentrate economically important elements).

    But this picture isn't the whole story. The Earth's crust is a much more complex system, and subducting ocean crust can sometimes lead to stretching, upwelling aesthenosphere, or extension of the overriding crust. This can lead to smallish scale rifting behind the zone of subduction. The low area is referred to as a back arc basin, because it forms "in back" of the arc caused by subduction.

    My off-hand comment was that due to their apparently contradictory behavior (local extension in an area of contraction/compression) they may as well be filled with pixie dust and unicorns. Not that I don't accept the observations of modern plate motions and bathymetry, but rather that "back arc basin" has sometimes become shorthand for any complex sequence of rocks and structures that were difficult to interpret. As a graduate student, it was tempting to wave one's arms and appeal to the back arc as a quick way of providing an "answer." It was more of a cautionary metaphor, than a dismissal of a particular set of tectonic models

    I've been dabbling with "Art Rage," a painting app for the iPad that I'm really enjoying. The island arc above was sketched out with that program. I also made a painting as my interpretation of these "magic" basins (the yellow dots are depositing pixie dust):
    Back Arc basin

    As a bit of a preview, I'm trying to summarize tectonics in terms of paintings, sketches, and photos because it's a good way to draw non-geologists into the big ideas of tectonics and because I'm playing around with the possibilities of using fantasy as a hook to get people to learn a little science.

    Middle Earth tectonics

    So my tweet about unicorns and pixie dust was also an obtuse reference to imaginary lands and realms of dragons and elves. Begging the question, does Middle Earth have a tectonic history?