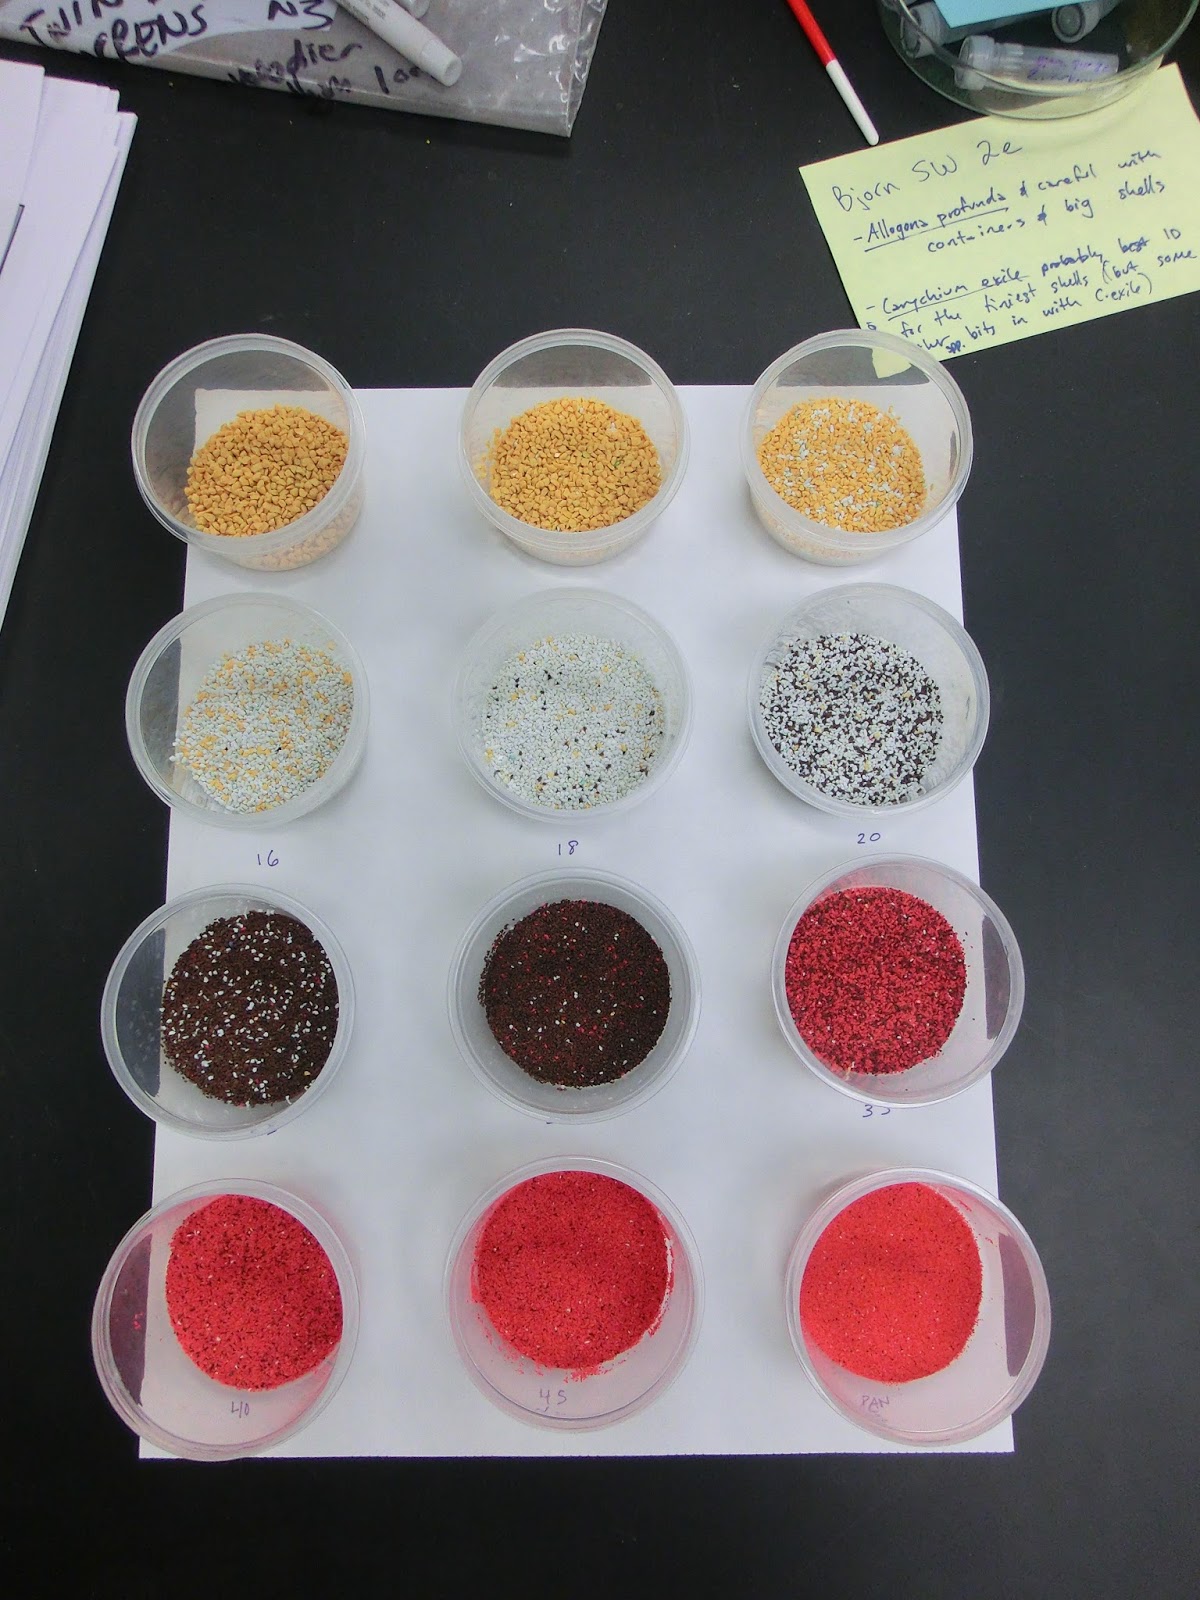
I have also been analyzing the sieved fractions for specific gravity (SG). As mentioned before, I noticed the white material was yielding lower SG values than the other colors. Steve Gough suggested that I let the material soak a little longer. I had done that with a few samples, but I've started to let them soak overnight. The white material is still producing slightly lower values than the yellow, brown, or red. Here's a summary of the results so far (the two lowest SG values weren't soaked overnight):
If you aren't moving at a snail's pace, you aren't moving at all. -Iris Murdoch
Showing posts with label specific gravity. Show all posts
Saturday, March 16, 2013
Even more grain data
I have also been analyzing the sieved fractions for specific gravity (SG). As mentioned before, I noticed the white material was yielding lower SG values than the other colors. Steve Gough suggested that I let the material soak a little longer. I had done that with a few samples, but I've started to let them soak overnight. The white material is still producing slightly lower values than the yellow, brown, or red. Here's a summary of the results so far (the two lowest SG values weren't soaked overnight):
Wednesday, March 13, 2013
Specific Gravity of coded media
I've been measuring the specific gravity of the color-coded plastic media. The sieve fractions that I separated earlier yielded some interesting preliminary results:
These represent single measurements - so there may be a lot of variation that's not accounted for. I used a volumetric flask and vacuum method to remove the air bubbles. The white fraction did appear to generate more bubbles than the other color fractions, so perhaps there is something inherent in the material to explain why they seem to have a slightly lower specific gravity. Does this influence how the material sorts itself during a stream run? Maybe, but there's lots of other fluid dynamics stuff to consider, too.
Here's one of Steve's Time-Lapse videos showing how running water can generate gorgeous color patterns.
Steve Gough posted a comment, but it was eaten alive by Google:
These represent single measurements - so there may be a lot of variation that's not accounted for. I used a volumetric flask and vacuum method to remove the air bubbles. The white fraction did appear to generate more bubbles than the other color fractions, so perhaps there is something inherent in the material to explain why they seem to have a slightly lower specific gravity. Does this influence how the material sorts itself during a stream run? Maybe, but there's lots of other fluid dynamics stuff to consider, too.
Here's one of Steve's Time-Lapse videos showing how running water can generate gorgeous color patterns.
Steve Gough posted a comment, but it was eaten alive by Google:
This is super interesting to us at LRRD! We ran a lot of specific gravity tests as we developed the media; and found very close clustering, but more at about 1.60. I'm not too concerned about a 0.05 difference between colors, but if it got bigger I would be! Melamine has very low water absorption (for some plastics it can be 10% plus), but it's possible that's part of the problem; you might try soaking all the samples for a few days before testing. Thanks!
Sunday, November 13, 2011
Thurs-Demo: The One with (Specific) Gravity
This week's demo has been a little late in coming - but I've got a few moments to get this up. Video is still processing though...
The plastic media that comes with the Emriver stream table is made of ground-up plastic. The stream model's physical behavior is largely determined by the relative difference between the density of flowing water and the sediment (there's also the viscosity of water, but that's another set of posts).

The above graph shows my student's results from soil mechanics lab last week. Students' results (red points) are a bit more varied than mine (blue). Aside from one errant point, student results lie along, or to the left of my own results - this suggests to me that it's a measurement error, rather than very different material. The leftward distribution points to less water than expected, rather than more. This could be the result of letting too much water dribble down the side and not into the measuring container, or waiting for all the water to stop dripping out of the spout. Or that the coarser fraction doesn't displace water as easily as a more graded mixture. Still, for 10-15 minutes worth of lab work, not a bad set of data.

This graph shows the results from a more extended set of measurements. The lab had students using a small (~100ml) overflow beaker - small errors like missed drops end up having a very large effect. So I tried using a much larger overflow beaker. My results were very consistent (basically a SG of about 1.50 ±0.01). But these values are a bit lighter than what Steve Gough (head of the LRRD) had for their color-coded material at 1.7. It's possible that my method allows for too much material to cling to the top of the beaker. Or the air bubbles trapped next to the surface of the plastic result in lighter-than-actual measurements.
So why graph the data this way? I can measure the plastic media's mass very accurately. And the amount of water displaced is proportional to the specific gravity of the material. So by making a bunch of measurements of two values, I can define a third as a linear function of the other two. It also saves some time on the calculation side of things.
The plastic media that comes with the Emriver stream table is made of ground-up plastic. The stream model's physical behavior is largely determined by the relative difference between the density of flowing water and the sediment (there's also the viscosity of water, but that's another set of posts).

The above graph shows my student's results from soil mechanics lab last week. Students' results (red points) are a bit more varied than mine (blue). Aside from one errant point, student results lie along, or to the left of my own results - this suggests to me that it's a measurement error, rather than very different material. The leftward distribution points to less water than expected, rather than more. This could be the result of letting too much water dribble down the side and not into the measuring container, or waiting for all the water to stop dripping out of the spout. Or that the coarser fraction doesn't displace water as easily as a more graded mixture. Still, for 10-15 minutes worth of lab work, not a bad set of data.

This graph shows the results from a more extended set of measurements. The lab had students using a small (~100ml) overflow beaker - small errors like missed drops end up having a very large effect. So I tried using a much larger overflow beaker. My results were very consistent (basically a SG of about 1.50 ±0.01). But these values are a bit lighter than what Steve Gough (head of the LRRD) had for their color-coded material at 1.7. It's possible that my method allows for too much material to cling to the top of the beaker. Or the air bubbles trapped next to the surface of the plastic result in lighter-than-actual measurements.
So why graph the data this way? I can measure the plastic media's mass very accurately. And the amount of water displaced is proportional to the specific gravity of the material. So by making a bunch of measurements of two values, I can define a third as a linear function of the other two. It also saves some time on the calculation side of things.
Wednesday, February 23, 2011
Specific Gravity
A few days ago, I posted a graph. I poured a measured mass of sand into a beaker that was designed to allow any displaced water to flow into another container. I then compared the displaced water to the mass of the sand I added. This gave me a quick way to measure how much heavier than water was the sand. This value is termed "Specific Gravity." It's dimensionless and allows us to understand how much a given amount of something will weigh (or mass, if you aren't factoring in gravity). It compares the mass of an object to an equal amount of water - it's comparable to density.

Instead of taking a few measurements and then averaging all the results, I graphed the mass of displaced water versus the mass of sand. The "trend line" represents a linear best-fit of the data. It's a way to calculate a variable that minimizes the inherent uncertainties with individual measurements. From the line, it appears that the sand is a little more than 2.7 times as dense as water (SG=2.7).
Steve Gough of Riparian Rap (Little River Research & Design) mentioned that their group was trying to figure out a way to measure mass flux in their river models. This got me thinking about how sedimentologists use the specific gravity of a fluid with suspended silt and clay as a method of figuring out how many particles of a given size are in a sediment sample (I talked about Stoke's Law previously here). Over time, the larger particles will fall faster - so the change in specific gravity of the fluid will start at some value and then gradually decrease as the large particles fall to the bottom.

This should work for the material coming out the drain on the river models, too. Although the particles are settling out of suspension much faster, the plastic grains will still cause a small change in the specific gravity as they push the water out of their way on their descent to the bottom. So I ran a trial - sure enough, the sand falling through the column of water created a small increase in specific gravity (about 4%). I also had issues with the sand interfering with the hydrometer as it fell. But, with a little work, one could probably translate change in SG to an amount of sediment moving through the column.
Incidentally, this is one reason why it's nearly impossible to get completely "sucked under" by quicksand. The suspended sand particles in water actually become more dense than regular water. Since the human body is about the same density as water, you are even more buoyant. Although you could still get stuck and starve to death...
I'm uploading a video - I'll add it to this page when it's ready. It's still loading, but if I don't get to the editing, you can preview it on Vimeo here.
Updated to embed video:
Funny: another recent post about SG here: http://jonathanmcgehee.wordpress.com/

Instead of taking a few measurements and then averaging all the results, I graphed the mass of displaced water versus the mass of sand. The "trend line" represents a linear best-fit of the data. It's a way to calculate a variable that minimizes the inherent uncertainties with individual measurements. From the line, it appears that the sand is a little more than 2.7 times as dense as water (SG=2.7).
Steve Gough of Riparian Rap (Little River Research & Design) mentioned that their group was trying to figure out a way to measure mass flux in their river models. This got me thinking about how sedimentologists use the specific gravity of a fluid with suspended silt and clay as a method of figuring out how many particles of a given size are in a sediment sample (I talked about Stoke's Law previously here). Over time, the larger particles will fall faster - so the change in specific gravity of the fluid will start at some value and then gradually decrease as the large particles fall to the bottom.

This should work for the material coming out the drain on the river models, too. Although the particles are settling out of suspension much faster, the plastic grains will still cause a small change in the specific gravity as they push the water out of their way on their descent to the bottom. So I ran a trial - sure enough, the sand falling through the column of water created a small increase in specific gravity (about 4%). I also had issues with the sand interfering with the hydrometer as it fell. But, with a little work, one could probably translate change in SG to an amount of sediment moving through the column.
Incidentally, this is one reason why it's nearly impossible to get completely "sucked under" by quicksand. The suspended sand particles in water actually become more dense than regular water. Since the human body is about the same density as water, you are even more buoyant. Although you could still get stuck and starve to death...
I'm uploading a video - I'll add it to this page when it's ready. It's still loading, but if I don't get to the editing, you can preview it on Vimeo here.
Updated to embed video:
Hydrometer Test from Matt Kuchta on Vimeo.
Funny: another recent post about SG here: http://jonathanmcgehee.wordpress.com/
Sunday, February 20, 2011
Sand...
Subscribe to:
Posts (Atom)


