
I had set up a demo to show some possible ways that we could "listen" to streams and arrive at some method of estimating bedload transport in streams. My set up was very simple. I had a short length of rain gutter stretched between two bins (one for water to flow into), an aquarium type pump, and some tubing to recycle the flow to the top of the rain gutter.
To "listen" to the river, I attached a microphone and an accelerometer from Vernier, hooked up to their Logger Pro software interface. The microphone was just a simple audio mic and it's range of frequency response was probably too fast (20 Hz) for a really good analysis (something around 1 - 10 Hz would be better, I think). The accelerometer was a simple, one-direction low-g unit. It's one of those that's sensitive enough that it will register a constant 9.8 m/s2 acceleration due to gravity if oriented vertically. Here's a sketch of the setup:

I intended to run the setup once without any sediment in the channel to provide a "baseline" of what the system would look like without a load. Then I was going to run the system with a bunch of coarse sand in the channel to observe the difference in the "noise" produced by bedload. Well, my experiment didn't get that far. The "noise" that I recorded for just the flowing water produced a very regular sine wave:
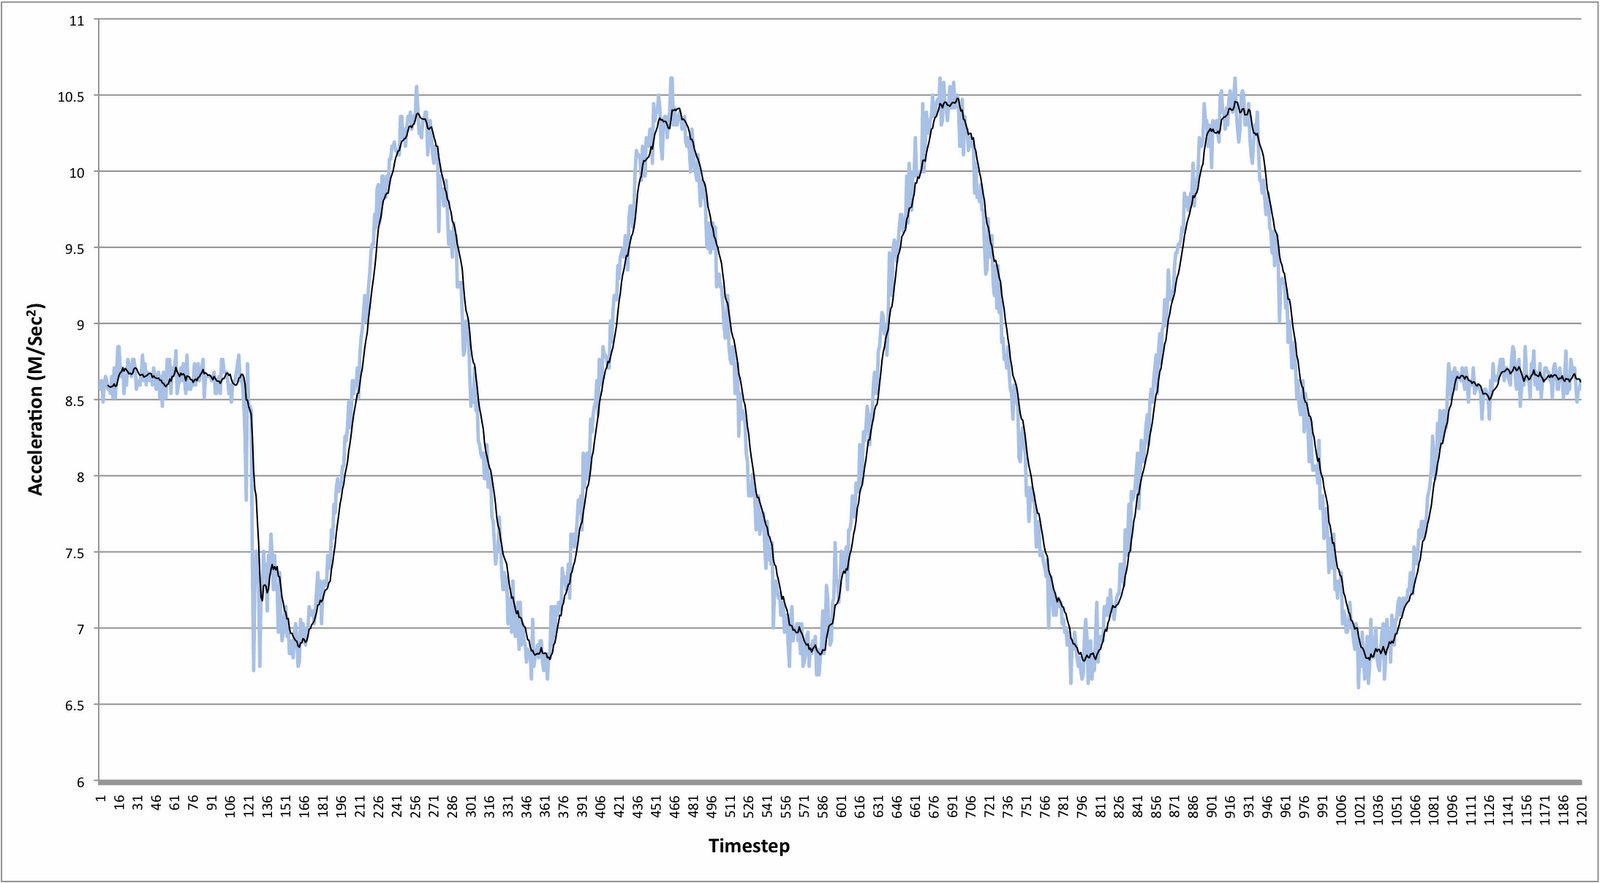
So, being the curious sort that I am, I began to wonder what could cause this pattern in the acceleration (as measured by the small accelerometer mounted on the rain gutter). First, you can tell the accelerometer wasn't mounted perfectly vertical, since the initial (and post-water movement) measurements are only around 8.6 (it should read 9.8). But then there are times it goes up (acceleration increases) and times it goes down (acceleration decreases). The total length of the test was 60 seconds - if you carry out the sine wave a little further, you can fit about 6 "wavelengths" in that time frame. That means there was something changing with a frequency of about 10 hertz. Was it something in the sinuosity of the flow? Was the stream meandering across the channel enough to make the channel wobble and register on the accelerometer?

The graph above is the result of four tests. In order to find out what is going on, the easiest thing to do is manipulate a variable or two, and see how the system responds. The variables I could easily change were: pump output (High/Low) and incline of channel (gentle/steep). That gives me four different tests. Low+Gentle (dark green), Low+Steep (light green), High+Gentle (dark blue), High+Steep (light blue). So, what explanations can you think of? Is there a consistent pattern in the data? Is there a fundamental flaw in my setup? I'm not sure - but it sure is interesting.
(PS - this is often how science works. Something looks interesting and we start trying to find an explanation. A mechanism or process that explains the observations. Sometimes the initial ideas don't pan out. Sometimes the work takes off in an unintended direction. But that's part of the fun!)
perhaps it's a function of how the water leaves the tubing? that is, if it's spurting out in 'bunches' like beer trying to escape an overturned bottle (for example)
ReplyDeleteBrian,
ReplyDeleteI suspect that's what it is *in part* but there's another development that I'll be posting about soon (hint: the pump itself is contributing to the signal).