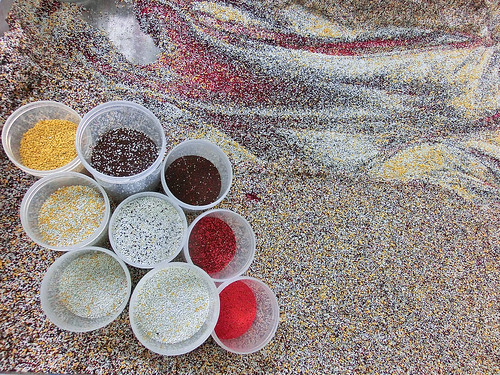
My soil mechanics students had their grain size analysis lab this week. It's fun - they get to analyze granular materials by playing with sand. Specifically, the plastic sand that comes standard with the Em2 stream table. Last year I ran the standard media through a stack of sieves. This year, I ran the color-coded plastic media through the sieves.

These gradation curves are a quick way of describing and comparing different sediments. The standard media (blue curve) is different by having a little bit less material between 2 and 1mm in size (but more material larger than 2.4mm), and quite a bit more fine material around 0.5mm. The horizontal axis is in microns (1 mm = 1,000 microns) and it's on a log scale, because there's such a huge range in diameter.

Here's a frequency curve showing the relative proportions of various size fractions. The "Phi Value" is another way sedimentologists scale the wide range of particles (Phi Value = -log2diameter in mm). So the Phi Value of a sand grain 1 mm in diameter is zero. Notice the big bump in the standard media between 1.5 and 2 phi. My own speculation is that as the material moves around, the big particles grind themselves down into particles around this size (0.3mm).
What you can't see, and what is the true brilliance behind the color-coded material, is how moving water separates the color-coded particles into various color patterns. You can also see the colors in the sieve separates, too.
So let's look at the distribution of grain sizes in the color coded media a little more closely:


Here's an overlay of the color fractions - the curves below represent approximate distributions of each individual fraction.

Here's a picture from Steve, the big guy at LRRD's blog (Riparian Rap), showing the Em4 being filled with unmixed coded media. Given that some of the smallest yellow particles are smaller than the largest white particles, un-mixing the coded media into perfect color fractions isn't possible by mechanical means alone.
My plan now: use the grain size distributions to create "color facies" for the plastic media - providing a way to do grain size analysis with time lapse photographs.
Update: talking with Steve over email, I realized that the color fraction "curves" as drawn above may imply more quantitative "knowledge" than I really have about the distribution of each color. Here's a histogram, with the color fractions approximated by visually estimating the proportion of different colors visible in each container (vertical scale is in grams):

Matt - what software will you use to analyze the imagery - ImageJ? Matlab?
ReplyDeleteJeff,
ReplyDeleteI'm looking at ImageJ, but using a high resolution (14 megapixel) camera, I may experiment with Photoshop too. My colleague uses ImageJ and Python to automate some of the image processing, so we have some methods in place with our Kinect 3D scanning.