Showing posts with label earthquakes. Show all posts

Tuesday, March 20, 2012

Pressure and Shear Waves in Springs

In an experiment fitting the vernal equinox, I was mucking about with springs today. I've been having trouble getting waves to show up well on the high speed camera. The ubiquitous "slinky" behaves a little oddly. Perhaps I'll write about shear waves in slinkys at some point. So I set up a few general springs in hopes of getting a pressure wave (longitudinal wave motion) that travels faster than the shear wave (transverse wave motion).

First run, shot at 1000 fps.


  • P-wave travel time: 30/1000ths second

  • P-wave velocity: 953 cm/sec


  • S-wave travel time: 34/1000ths second

  • S-wave velocity: 841 cm/sec


A second run, this time shot at 3000 fps.


  • P-wave travel time: 107/3000ths second

  • P-wave velocity: 802 cm/sec


  • S-wave travel time: 127/3000ths second

  • S-wave velocity: 676 cm/sec


Both show the shear (transverse) wave moving at a slower velocity compared to the pressure (longitudinal) wave. One of the methods we have to estimate the location of earthquakes is due to the difference in travel times. Kind of like using the number of seconds between the thunder and the lighting flash to estimate how far away the storm is. The large quake that struck Mexico today was probably located in part by the difference in P- and S-wave travel times.

Now I believe this demo is ready for my intro students...

Wednesday, March 30, 2011

Is it too soon to call shenanigans?

I've been looking over some interesting earthquake science today. The first is the Nature Geoscience paper (wired.com summary here) about the statistical (and physical) lack of any evidence for major seismically "triggered" earthquakes far-afield. That is to say, a big earthquake along one plate does not appear to increase the chance for another big quake along a different boundary.

Then there's a guest blog by Christie Rowe about earthquake prediction and the unpleasant yet real situation of uncertainty.

Some of you may be familiar with the recent issue many of us in the geology community have taken with Simon Winchester's "comments" about California.

(screen cap from the Fox interview with Winchester)

Today, Donald Prothero (writing for skepticblog) has a blog post about another quake-quack, Jim Berkland. It got me wondering - are these two (Berkland and Winchester) connected? I did a quick search of "teh google" and didn't come up with anything directly linking them. Alarmists and conspiracy theorists have been buzzing about the comments both of them were making last week. They were both interviewed by Fox News. They both talk about the "four corners" of the Pacific Plate (a horse-pucky idea in the first place) and they both have undergraduate schooling in the geosciences. But I haven't found any coordinated effort between them, so it's more likely a case of convergence.

(screen cap from the Fox interview with Berkland)

This doesn't make things any less frustrating - there are real risks. There are real hazards. Arm waving and claiming persecution from mythical "powers-that-be" isn't helpful. There is nothing to suggest that either Winchester or Berkland have any real handle on the geological systems actually involved. Just an ambiguous pseudoscience of hyperbole and alarmism.

Thurs-Demo: The one that should have worked last week

This demo has been a long time coming. I came up with the idea back in '97 as an undergrad. We were looking at self-organized, critical systems and the 1992 Landers earthquake was brought up as a possible system where small perturbations may be enough to generate change. So I rigged up a demo - and it worked nicely. Now, 14 years later (yeesh - has it been that long?) I have this demo-a-week thing going on and I thought it would be a good idea to try it again. Especially given the recent interest in the Japan quake, my Earthquake Machine (El Temblor!) and the current brouhaha regarding remotely triggered seismicity and earthquake predictions. But my attempt last week was less than impressive.

Soda Pop Earthquake from Matt Kuchta on Vimeo.


I probably should have also existing bubbles being shaken loose as an additional factor in causing movement.


Some background: A magnitude 7.3 (ML) earthquake near Landers, California appears to have triggered seismicity in several locations in the western US - especially in areas with hydrothermal systems or sites with recent volcanic activity occurred such as Long Valley Caldera (Hill et al, 1993, Linde et al., 1994, Johnston et al., 1995). The epicenter of the Landers quake was several hundred kilometers south of the Long Valley Caldera - what these authors suggest is that bubbles within magma or hydrothermal systems were "shaken loose" as a result of the earthquake passing through the fluid and these bubbles created extra pressure that was exerted on the crust, inducing seismic activity.


It's interesting to note that Linde et al (1995) speculated that there may have been volcanic eruptions triggered by other regional earthquakes including 1707 eruption of Mt. Fuji (Hoei M=8.4), Mt. Calbuco in Chile - 1960 (M=8.6), and the 1980 "Pozzuoli crisis" after the (M=6.9) Iripina quake. I found this interesting, especially given the recent set of posts by Jessica Ball (Magma Cum Laude) discussing the possibility of volcanoes triggering earthquakes (Part 1 and Part 2).

Sources:
Hill et al (1992) Seismicity in the Western United States Triggered by the M=7.3 Landers, California Earthquake of June 28, 1992, Science vol. 260, pp. 1617-1623.

Linde et al (1994) Increased pressure from rising bubbles as a mechanism for remotely triggered seismicity, Nature vol. 371, pp. 408-410.

Johnston et al (1995) Transient Deformation during Triggered Seismicity from the 28 June 1992 Mw=7.3 Landers Earthquake at Long Valley Volcanic Caldera, California, Bulletin of the Seismological Society of America, vol 85, no. 3, pp. 787-795.

Tuesday, March 22, 2011

What not to write

Chris Rowan has a good point about baseless, sensational predictions regarding earthquakes.. I was alerted to the article in question last night. I think I may have to include a "just in time" in-class activity regarding these two articles in my class tomorrow.

Update:
Andrew at About Geology provides some links and a review of one of Winchester's books.

Natalie Wolchover has another good, detailed tear-apart of the Newsweek thingy.

Friday, March 18, 2011

Some more Earthquake Machine Data

Yesterday's Earthquake Machine demo yielded some nice data. Some of the force and acceleration graphs show distinct events immediately prior to a large slip event:

y-axis: Force (red) and acceleration (blue); x-axis: time (about 0.5 seconds per tick mark)

Unfortunately, nothing really showed any decent "aftershock" activity. It may be that the time interval I was measuring wasn't small enough. Or, the friction (strength) of the material was enough to avoid any noticeable aftershock behavior. I'll have to try using different "rough" substrates - perhaps I can generate aftershocks if my friction surface is sufficiently unstable. (Pea gravel, anyone?)

Thursday, March 17, 2011

Thurs-Demo: The one with the Earthquake Machine

There is a Universal Truth (tm) related to teaching geoscience: there will always be a current event to point to. We live on a dynamic planet. Things move - sometimes undesirably. Japan is suffering from one of the strongest earthquakes in recorded history. Added to this are the compounded damages from the tsunami and the nuclear reactor failures. There are plenty of good discussions of the specifics behind the Sendai Earthquake.

Anne Jefferson at Highly Allochthonous has a good blog roundup on some of the events.

Chris Rowan (also of Highly Allochthonous) has a good rundown on the continued aftershocks of the Sendai Quake. He's also got a description of the kinematics of the quake. It's especially nice if you're trying to rectify those "beach balls" with the crustal block diagrams...

Callan Bentley's Mountain Beltway has a good post highlighting the GPS displacement vectors (distance and direction of motion) from Japan. He also provided a great initial summary of the quake.

Jessica Ball at Magma Cum Laude (one of my favorite blog titles) describes a few reasons why there are tenuous links between earthquakes and eruptions.

As I said earlier: it's like trying to pop a zit on your forehead by clenching your buttocks.

But back to the Sendai Earthquake. How to use this as a "teachable moment?" First, we can provide ways to help monetarily (through the Red Cross or similar) - although I would argue that Haiti is still worse off because of their lack of resources and infrastructure to help themselves. We can also educate people about earthquakes - perhaps by providing educated citizens, we can all benefit from better policies and systems in the future (hear that, gov. Walker?). Not just the dangers and hazards, but their underlying mechanics - how do they "work?"

So let's break things down a little bit. What are the forces at work here? We have tectonic forces, pushing the pacific plate beneath the island arc of Japan. The weight of the island arc pushes against the subducting pacific plate and creates a resisting, friction force that opposes the tectonic force driving the plates. When all forces are equal, nothing moves. As long as the friction force opposes the tectonic force, the plates will not move. But eventually, the applied tectonic force exceeds the friction force, and the plates move. This movement shakes the crust and releases energy (seismic waves) that travels through the earth. The more sudden and longer the movement, the stronger the shaking/earthquake. We can simplify this with a "free body diagram" of the forces involved (greatly simplified, but a decent first approximation).


To simplify this further, and bring the mechanics of the system into the classroom, there are several designs that use a brick on a spring. Pulling on the spring applies a tension force on the brick, but the brick does not move until the tension exceeds the friction force between the brick and the table (or sandpaper, or whatever). The forces are oriented in the same direction. Technically, the more analogous setup would be to have a compression spring, driven by a screw mechanism, since tectonic forces are more often compressive forces, not tension (but the direction and elastic behavior of the spring is still reasonably close).


The friction force is determined by the "Normal Force" (FN), which acts perpendicular (normal) to the surface and a "coefficient of friction." The greater the normal force, the harder the object is to move (try moving a refrigerator - and then try moving the box the fridge was shipped in). In addition, the coefficient of friction is a dimensionless number that describes how easy or hard it is to slide to objects past one another. Ice has a low coefficient, sandpaper has a relatively high coefficient.

For our "Earthquake Machine," the friction is provided by the brick and the sandpaper. The tectonic force is applied by pulling on the string (which is attached to the spring). The spring transfers the tension to the brick. Once the "tectonic" force exceeds the friction force the brick will slip forward - but only a short distance. The friction causes the brick to slow down and the applied force drops. The spring accumulates some of the tension by deforming (strain), then the accumulated strain can be released. When the spring's force diminishes to that less than the friction force, the brick stops moving; it sticks. The strain on the spring increases again until another slip. This is often referred to stick-slip behavior and is why many active faults don't shake all the time.

Here's the video:

Earthquake Machine Demo from Matt Kuchta on Vimeo.


I named mine "El Temblor!" I need to find some images of mexican wrestlers to paste on the sides and the brick to liven it up, I think. I designed mine to be easy to watch the brick, simple to construct, and cheap. Sort of a minimalist Earthquake Machine that I then loaded up with electronic sensors to graph some data (it's not SCIENCE until you graph some of the data...).

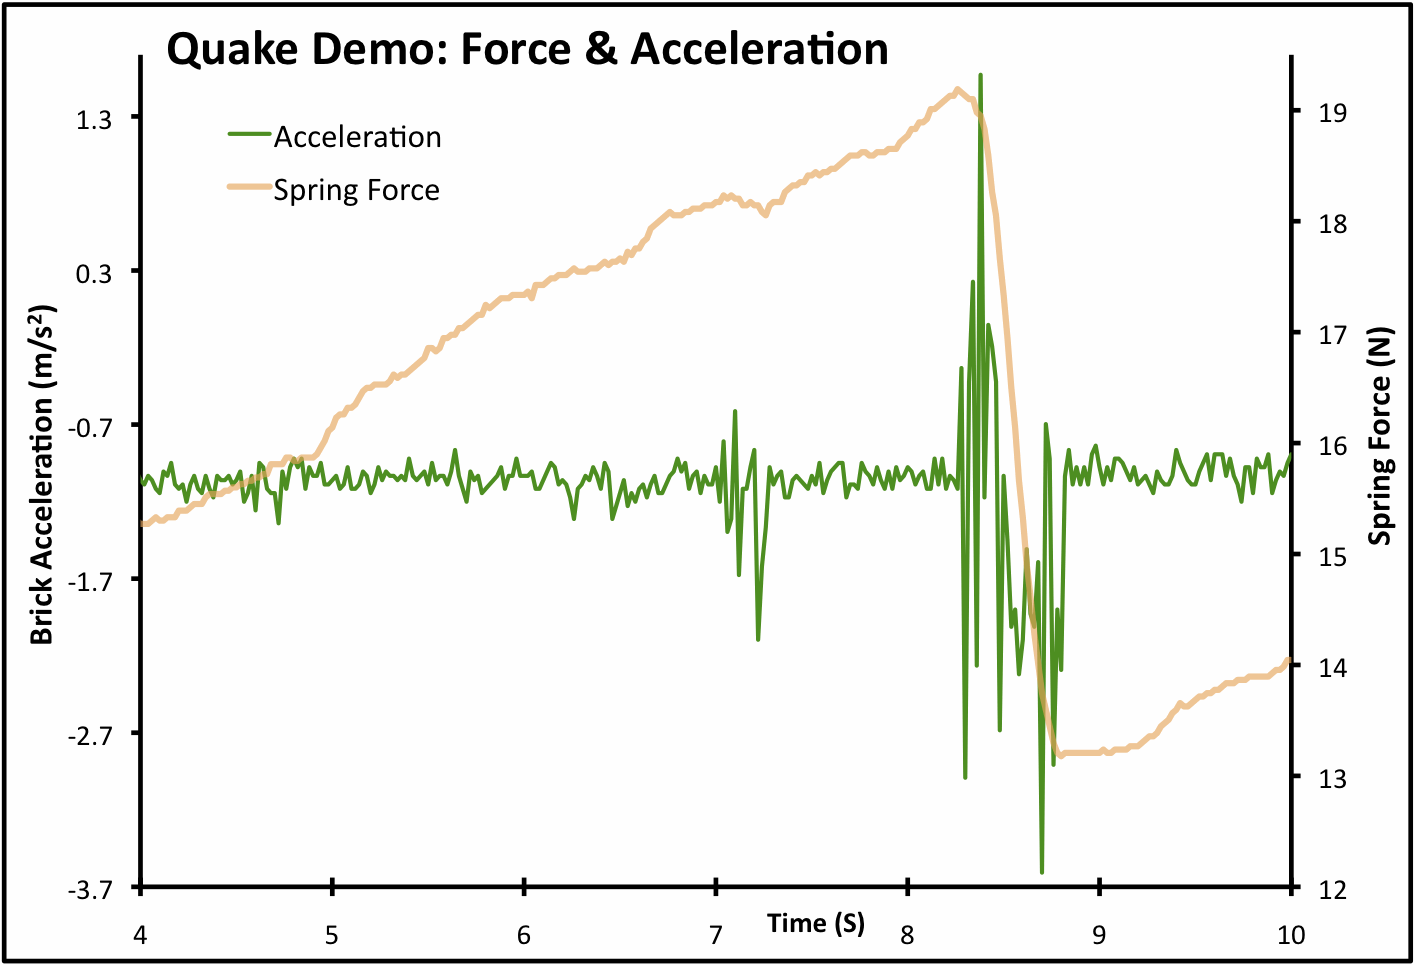
Let's look more closely at the force and acceleration data for one stick-slip set:


I was trying to keep my stress rate (winding up the spool) constant. You can see that the tension force (orange line) increases until the brick slips - releasing a bunch of accumulated tension stress. As the stress is released, the brick accelerates forward (green line). The brick slows down due to friction, which is why the acceleration graph goes into negative values. By adding a few data-logging tools (LoggerPro materials in this case), we can better see the magnitude of changes in the system. Plus, we now have a way of understanding what geologists are measuring before, during, and after earthquakes.

For a seismologist (the earthquake-studier), we can estimate the stress acting on rocks by measuring the relative movement between to pieces of crust. Places where the crust is moving tells us the stress is not accumulating. A lack of movement between plates of crust tells us the stress is being stored up (winding up the spring, so to speak). How much stress is accumulated can be estimated by the behavior of the rocks themselves (the strength of the spring) and the movement that should have occurred (how much the spring is deformed).

We don't know exactly when the crust will move, but we can provide a reasonable estimate of how strong the likely earthquake will be when it does move. If we're really lucky, we have hundreds (or thousands) of years of data that tells us how frequent earthquakes are in the region. So we may not know the hour, day, or even year - but we can at least point to areas that have a greater potential to move within a few decades or so. Given that cities are designed to last for many years, this is a pretty good estimate of risk for any particular city. Those governments with the capability and motivation to do so can plan for these earthquakes by mandating building codes, proper engineering, planning for disasters and so on. Japan's building codes likely saved tens of thousands of lives last friday.

So how can we apply our model to other situations? Take a look at this graph:

There are distinct periods of "stick" and "slip." The maximum stress accumulated was relatively constant, although there were a few slips near the beginning and end that were bigger than those in the middle. The friction was greater at the beginning and again at the end. So we have stick-slip movement here, while it more-or-less "creeped" along for part of the middle.

Here's another image:

Here we have another pattern. Mostly medium-sized slips until the very end. In the real world, these slips might represent the historical record of a medium-ish earthquake every century or so, and then a very big quake (arrow). Looking at the historical record, seismologists might decide that the "normal" pattern of medium-sized quakes had ceased and something was sticking more than it had been - making a stronger earthquake more likely. Note also the small accelerations (quakes) that don't interrupt the general increase in accumulated stress - not every quake reduces the possibility for another one.

That's not to say the big quake was "overdue." While our understanding of the model is very good, there may be other factors - perhaps the stress was being relieved somewhere else. Or perhaps the rocks aren't strong enough to store that much elastic energy. But it is never overdue.

Earthquakes are like wizards - "they arrive precisely when they mean to."

So what is the "spring" in our model? The rock itself. Rock has some elastic characteristics that allow it to store energy and then release it when the strength of the material is exceeded. I blogged about the elastic rebound theory earlier by using spaghetti noodles.

Breaking Spaghetti from Matt Kuchta on Vimeo.


Update for Steve:
Here's a link to the pasta mechanics post. (PS - I'm probably going to write another "geomorphically correct art" post this week)

UPDATE 2: Thanks for the pickup from Boing Boing and Vernier.
For those of you who are interested, the equipment was the low-g Accelerator and the dual-range force sensor. I'm not sure who else makes comparable equipment, but you could also rig up a standard spring scale and use some kind of "wobbly" thing on the brick (like a thin wire, or cup of water) to show the magnitude of movement.

Friday, March 11, 2011

Lunatic behavior

Lunatic comes from the late Latin, lunaticus. This word, as adjective or noun, pertains to being foolish, eccentric, or absurd. It stems from the ancient belief that changes in the moon caused intermittent insanity (Luna = moon). Kind of a medieval version of the "Twinkie Defense." But while changes in the moon may correlate with people acting weird (particularly those who are inclined to believe in some lunar link), there is no reason to think the moon causes this weirdness. It's in your heads, people. Erik, at the Eruptions blog, dives into this concept in great detail.

There have already been murmurings among the astrology crowd that the full moon set to arrive in a week is going to be some kind of "supermoon," capable of destroying cities, leveling whole continents to waste with earthquakes and volcanoes and über-tidal surges. Whatever. Yes, the moon's gravitational pull does cause tides. So does the sun. But connecting the moon to any specific event on Earth - especially catastrophic changes - is beyond flimsy. Imagine this: your head is Earth. Take a ping pong ball and hold it out at arm's length - this is the moon.


To represent the change in distance between the furthest and closest distances of the moon, just bring the "moon" one ping-pong ball closer. This is your "supermoon." Do you see any change in the size of the ping pong ball? Perhaps - and on a clear night, we may think it looks brighter than others. Is it? Or are you judging this based on the fact that the previous three weeks have been comparatively darker - we could measure the light levels and probably see an increase, but are our eyes sensitive enough to accurately detect the change? I'm not sure. But the change in gravitational force it exerts? Now we're looking at fractions of fractions (due to the difference in gravitational pull between the sides nearest and furthest from the moon).

In the head/ping pong model, the sun is going to be a 54-foot diameter sphere nearly a quarter of a mile away. Both of them are exerting a gravitational pull on the earth. But any effect on us, or a particular spot on the earth's crust will be tiny. Tectonic forces and gravitational forces exerted by Earth itself will be thousands of times greater.

There's also the temptation to link the eruptions in Hawaii to the earthquake in Japan. Or some other volcanic/earthquake event with another far across the globe. The unifying theory for all these events is Plate Tectonics. Not some mystical planetary voodoo. While far-field earthquakes can occur (New Madrid, for example), the idea that an earthquake on one side of the globe will cause volcanic eruptions on the other - or some (by gravitational standards) tiny change in orbital gravitation is posing a great risk of catastrophe is ridiculous. It's like trying to pop a zit on your forehead by clenching your buttocks.

Earthquakes

Some big events in Japan, as a huge 8.9 mag. earthquake shakes much of the island of Honshu. There was an associated tsunami that is washing across the Pacific. Callan Bentley has a good summary and intro to the events.

I was looking at the Hawaii seismic data - the newly formed Kamoamoa vent eruption appears to be waning and there's minimal incandescence visible on any of the webcams. The Hawaiian Lava Daily blog was mentioning that sea entry had stopped for now and he was waiting for earthquake swarms to point to where activity would re-emerge.

I had been poking around the HVO earthquake map and saw several small earthquakes just off the coast of Kalapana (where the lava had been pouring into the sea until last weekend). I tweeted a bit with Ron Schott (@rschott) about these quakes, and I think this could be related to bench collapses. As the lava pours into the sea, it cools - and forms an oversteepened slope or cliff. The quakes were a bit deep for this (10 km), but these are small quakes, so it could be related to problems in data resolution.


There was another fairly strong pair of quakes (3+) early this morning, before the tsunami, and the distribution of quakes still appears clustered around Kalapana.


Here's the whole-island view. You can see the flurry of seismic activity from the Kamoamoa event. It's still not enough data to really say what's going on, but I do find it interesting the majority of recent seismic activity has shifted to the coast (for now). If you will allow this paleobiologist to speculate on why - my first guess would be that there is some settling and "relaxing" related to the cessation of flow down the pali and into the ocean at Kalapana. I don't see it as foreshadowing new eruptive activity - but I could be totally wrong, I guess. It's happened before.